

Global Stocks: Corporate Profits and How Much You Pay for Them Are Key (Part 1)
In terms of absolute returns, the United States has dominated the rest of the world. It is also a very expensive market, although not the most overvalued by one key measure.
Our asset allocation has favored the United States and Japan at the expense of Europe and Emerging Markets. A long-term perspective on corporate profits and valuation might still justify this stance. Let’s see how.
The Science and Art of Valuing Investments
How do you value an investment? While there is a bit of “art” to defining that, we can still apply some “science” to get us closer to the answer.
One simple way is to look at the annual profit the investment is expected to produce. Then figure out how much you are willing to pay for it. Whether it be equities, real estate, or an oil well, you typically would expect to pay some multiple (several years equivalent) on that one year’s worth of profit.
If you look at this ratio as valuation divided by profit, you have what many call a “Price to Earnings” ratio. There are other ways to describe this ratio (for instance, capitalization rates in real estate where you take the reciprocal, e.g. profit/cash flow divided by valuation paid, and expressed as a percentage).
For the purposes of this exercise, we will use the “Price to Earnings” approach.
Let’s look at profits prior to the last (and quite severe) bear market of 2008.
Earnings Recovery Strong in US and Japan, Weak in Europe, Tepid in Emerging Markets
The chart below shows earnings compiled by MSCI for 5 major regional stock markets around the world: Emerging Markets, Japan, the United States, Europe (Excluding the United Kingdom), and the UK. The chart looks backward at what earnings were in the year 2008 (known as “the Global Financial Crisis”). Each regional market’s earnings are indexed to the number “100”.
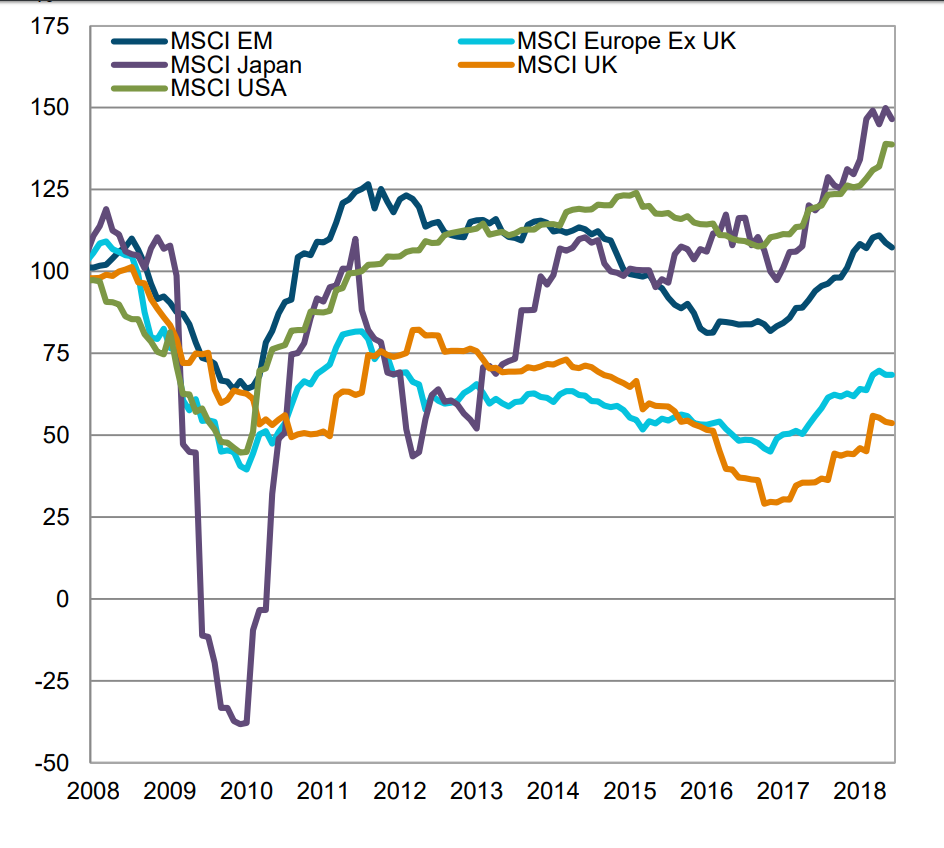
The chart then examines what happened to earnings every year up to 2018. We particularly want to focus on the years 2008 and 2018 for this analysis. 2008 is the start of our analysis (arguably a “high” level of earnings prior to the bear market and economic recession). 2018 reflects where earnings are right now.
If a line for the year 2018 is above 100, that means earnings today for a given regional market are above their level back in the prior cyclical peak of 2008. Companies in that market are making more money than a decade ago.
However, if a line in 2018 is below 100, that means earnings today are still below levels of 2008.
What can we learn about earnings in each of these major regions of the world?
2008 |
2018 |
Cumulative EPS Growth from 2008 to 2018 |
|
| EM | 100 | 108 | 8.0% |
| Japan | 100 | 145 | 45.0% |
| US | 100 | 138 | 38.0% |
| Europe ex-UK | 100 | 68 | -32.0% |
| UK | 100 | 53 | -47.0% |
Source: T. Rowe Price, MSCI, and Ambassador Wealth estimates.
Earnings are at historical highs in these markets:
- Japan
- United States
Earnings are better than 2008 now, but they are below prior historical peaks (and those of other strong markets):
- Emerging Markets
Earnings are below (indeed, substantially below) levels of 2008:
- Europe ex UK
- UK
In a future blog, we will discuss some of the reasons and potential future implications for the direction of earnings and valuations.