

2018 Was Truly an Unusual Year for Markets
- A surprising winner for the top asset class in 2018
- Earnings grew, yet market prices declined
- Seasonal holiday trading patterns did not pan out
You can read about our outlook for 2019 in the Investment Newsletter. In the meantime, here are 3 facts that made the year 2018 truly unusual in recent market history.
Cash: The New Winning Asset Class for the First Time in a Decade
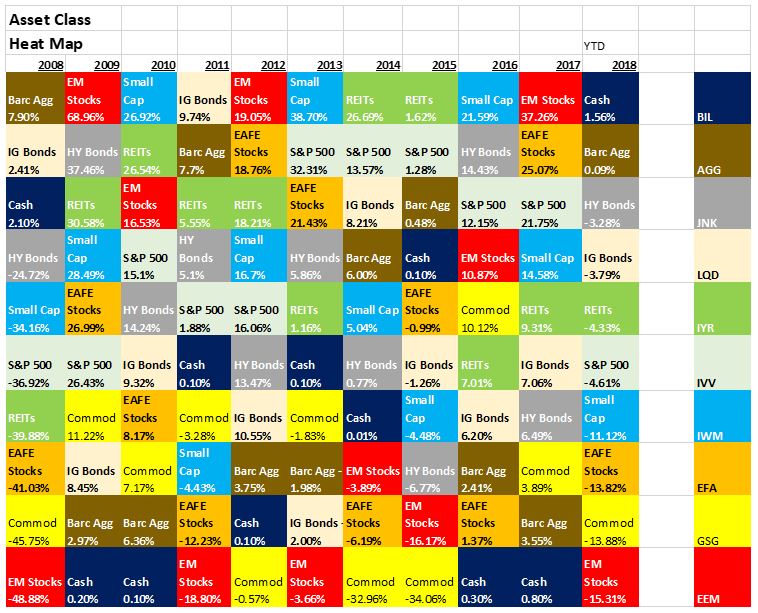
What is this chart?
- This chart ranks annual returns on different asset classes from equities to fixed income to alternatives.
- Assets on the top of the row indicate the best performers for a given year; assets on the bottom are the worst for a given year
Why does it matter?
- Cash and fixed income occupied the top 3 positions, which had not occurred since 2008.
- Cash was the best performing asset for the year. Returns were positive but below US core inflation of 2%.
- Foreign stocks and commodities occupied the bottom 3 positions. Economic growth in Europe and China greatly decelerated in 2018. This is not an unusual event for them to be at the bottom in the last decade.
- US equities declined. The S&P 500 was the best performing major world equity market, but still negative. (It had been up over +10% through September before coughing up its gains and then some in the fourth quarter.)
Earnings Growth Did Not Reward Investors
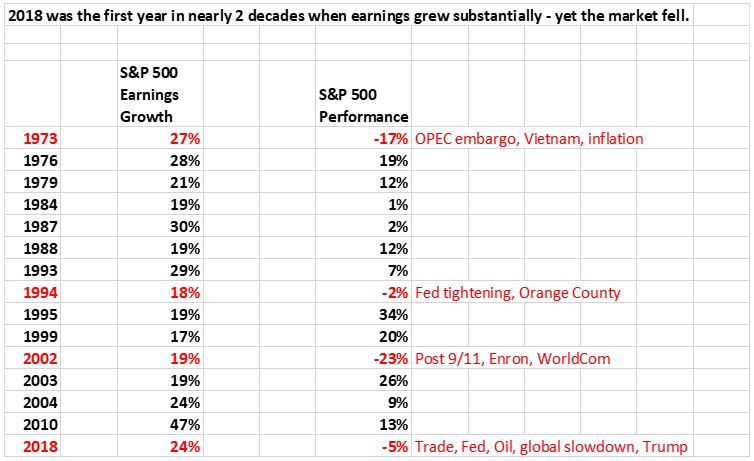
What is this chart?
- This table displays historical returns of the S&P 500 when annual corporate earnings growth is strong (above 17%).
Why does it matter?
- 2018 was only the fourth year in 45 years when earnings grew substantially – yet the market declined.
- One factor in play might be that roughly half of this earnings growth came from lower corporate tax rates – a factor that will not recur in 2019.
- Other macro worries pressured the S&P 500 (and most other world markets) in 2018.
Historical Trading Patterns Did Not Repeat Themselves in 2018
- Rally after midterm elections did not recur in 2018.
- Split Congress did not inspire stock markets in 2018.
- Seasonal peak in 4q did not result in stock market rally in 2018.
- December 2018 was the worst month for stocks since 1935 (midst of the Great Depression).