

Investment Newsletter 2Q18
Your Investments and Ambassador Wealth:
Flat Quarter Does Not Mean Dull
Stuart P. Quint III, CFA
Managing Director – Investments and Compliance
- Brief market update after a little roller coaster in 1q18.
- Signs of hope and areas of concern in markets
- Themes we like and dislike
At face value, 1q18 seemed like a fairly calm quarter. Major asset classes posted slight losses while emerging markets and commodities posted gains. The S&P 500 was not “the only game in town” to start the new year.
Asset Category |
Total Return in 1Q18 |
| S&P 500 | -1.0% |
| Russell 2000 (US Small Cap Stocks) | -0.2% |
| MSCI EAFE (International Developed Equities) | -1.5% |
| MSCI EM Free (International Emerging Markets) | +2.6% |
| GSCI Commodity Index (Commodities) | +2.3% |
| Barclay Aggregate (Fixed Income) | -1.5% |
| Barclays High Yield (High Yield Corporate) | -1.5% |
Source: Ycharts.com
However, face value masks the rocky ride markets have experienced since rallies stalled out at the end of January. The numbers show a mild correction after a strong rally in 2017.
Asset Category |
Total Return from 1/31/18 to 3/31/18 |
| S&P 500 | -6.3% |
| Russell 2000 (US Small Cap Stocks) | -2.7% |
| MSCI EAFE (International Developed Equities) | -5.6% |
| MSCI EM Free (International Emerging Markets) | -5.0% |
| GSCI Commodity Index (Commodities) | -2.7% |
| Barclay Aggregate (Fixed Income) | -0.3% |
| Barclays High Yield (High Yield Corporate) | -1.4% |
Source: Ycharts.com
As a reminder, we wrote both in our January Investment Outlook (link to 1q18 newsletter) and February blog (link to Market Roller Coaster) that it would not surprise us to see a correction at some point.
Markets in 2017 were too calm to avoid some sort of uptick in volatility in the near future. A correction came (albeit mild by historic standards). In and of itself, a correction does not have to portend the end of a bull market, but it would not be surprising to see more moderate returns than 2017 in the near term.
In spite of the recent correction, there are some bright spots. Diversification away from large US stocks and bonds was generally helpful.
- Bonds are no longer the simple “risk-off” asset that rallies when risk assets are selling off. Even in a soft market, bonds were slightly negative in the recent correction (and negative for the quarter). So long as the Fed desires to raise short-term rates further and valuations remain high, fixed income returns might continue to be challenged.
- Small cap and commodities held up in the correction. It is possible that the markets were concerned more about volatility than a significant decline in economic growth prospects. Both categories lagged US large cap equities in 2017. Though emerging markets sold off in line with the US, they still managed to post a positive performance for the quarter.
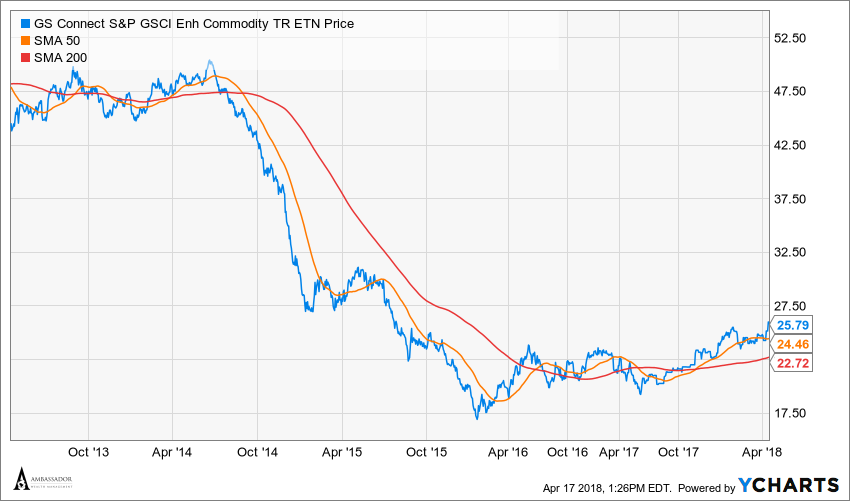
- Commodities might finally begin to see a sustained but gradual uptick. Possible fundamental catalysts include limited supply growth (copper, perhaps oil) and demand recovery driven by global growth. Technically, commodities have underperformed stocks and bonds over the last several years. Investors looking for diversification and believing in continued economic recovery might shift some allocation into commodities. (If growth were to sputter, then commodities might not be so attractive.)
Nevertheless, 5 indicators indicate the more fragile state of the markets in March relative to last December:
- FANGs[1] fizzling – or merely pausing?

Source: https://www.theguardian.com/technology/2018/apr/08/facebook-to-contact-the-87-million-users-affected-by-data-breach Source: http://money.cnn.com/2018/03/21/technology/eu-europe-tech-tax/index.html - Global economies less sizzling (though still positive). After nearly 7 months of consistently positive economic surprises not only out of the US, but also Europe, Japan, and emerging markets, data has inflected downward in 1q18. It is far too early to call for global recession, as levels went from too hot to just hot. Policy tightening is a wild card as to whether things get much worse.
Source: Renmac. - Trade protectionism reemerging. President Trump announced $20bn of tariff hikes on Chinese imports and has threatened to impose another $100bn. Depending on what is implemented, the size of tariffs appears small compared to the potential impact of $800bn of fiscal stimulus on the $20,000bn ($20 trillion) size of the US economy.
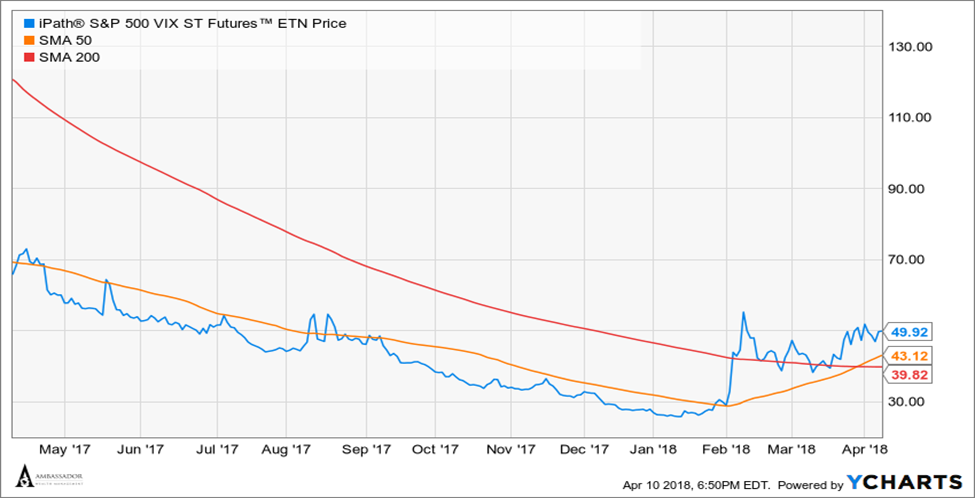
- Volatility spiked (finally after a long hibernation since presidential elections in 2016). An outlook for higher interest rates as signaled by the Fed, investor complacency, technical factors, and short-term political concerns contributed to pushing volatility from historical lows. To put in perspective, however, volatility simply has shot back to levels of summer 2017.
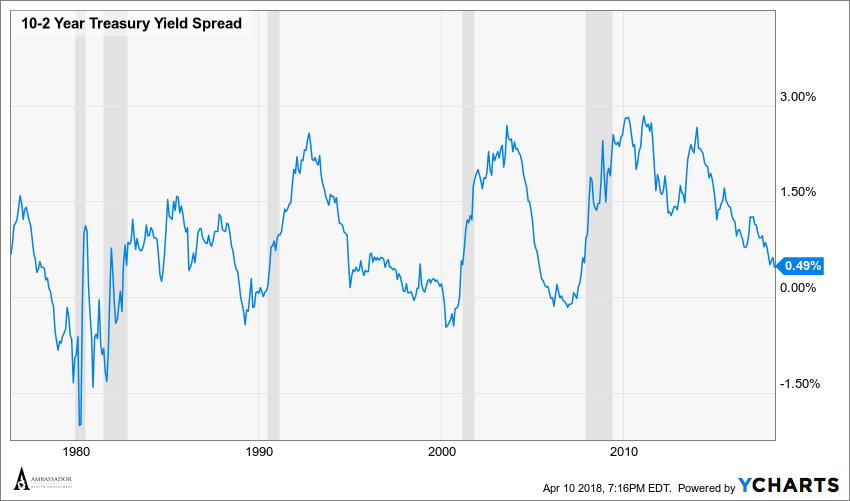
- Yield curve flattening. Markets have started to worry that the Fed might be raising interest rates too quickly at the risk of economic growth. This is a key area to monitor for if and when we need to temper even our cautious optimism further.


We will continue to monitor risks and opportunities in different asset classes.
What we like:
- Broader equity exposure beyond S&P 500 (small cap, Japan, emerging markets)
- Liquid absolute return strategies less correlated to equities or fixed income (call writing)
- Exposure to commodities might act as a hedge against broadening global growth and/or geopolitical events
What we dislike:
- Much of fixed income (duration, most credit pricey)
- Europe
- Many illiquid “alternative” strategies
[1] “FANGs” is an acronym for popular technology stocks Facebook, Amazon, Netflix, and Google. See https://www.investopedia.com/terms/f/fang-stocks-fb-amzn.asp